When evaluating a portfolio’s performance, it’s not just about the returns—it’s about how much risk was taken to achieve them. That’s where risk-adjusted performance measures come in. These metrics help investors and portfolio managers understand whether the returns justify the risks involved.
Here are 10 essential risk-adjusted performance measures you should be familiar with:
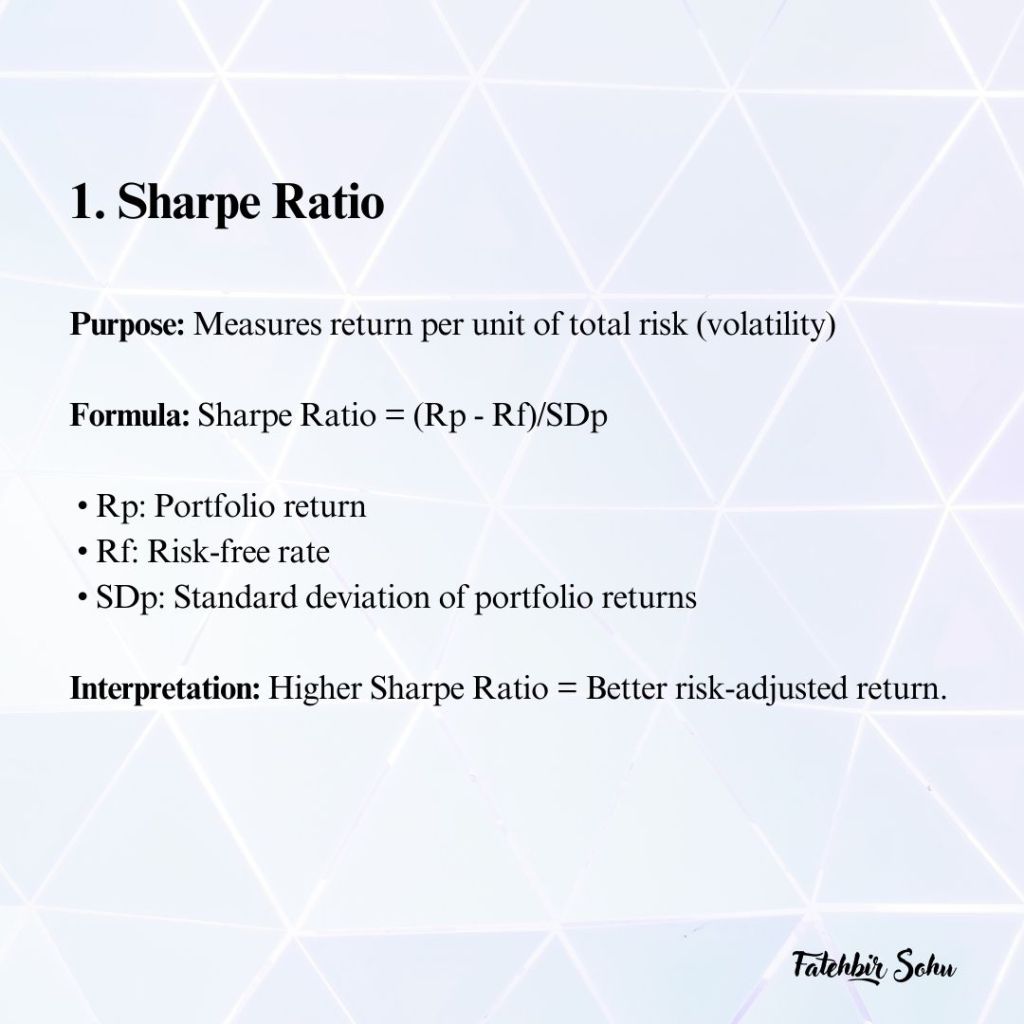
1. Sharpe Ratio: Measures return per unit of total risk (volatility).
2. Treynor Ratio: Focuses on returns relative to market risk (beta).
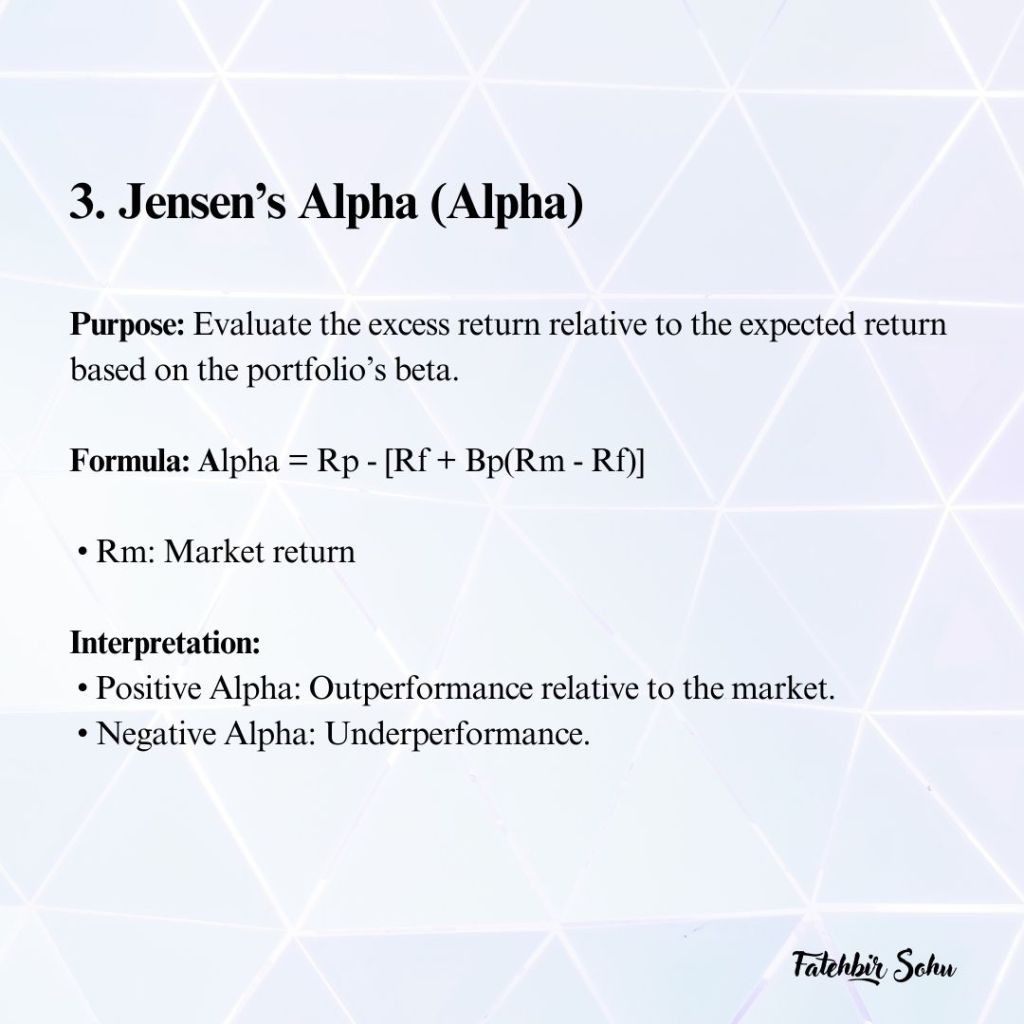
3. Jensen’s Alpha: Assesses excess returns relative to expected market returns.
4. Information Ratio: Compares active return to the volatility of those returns.
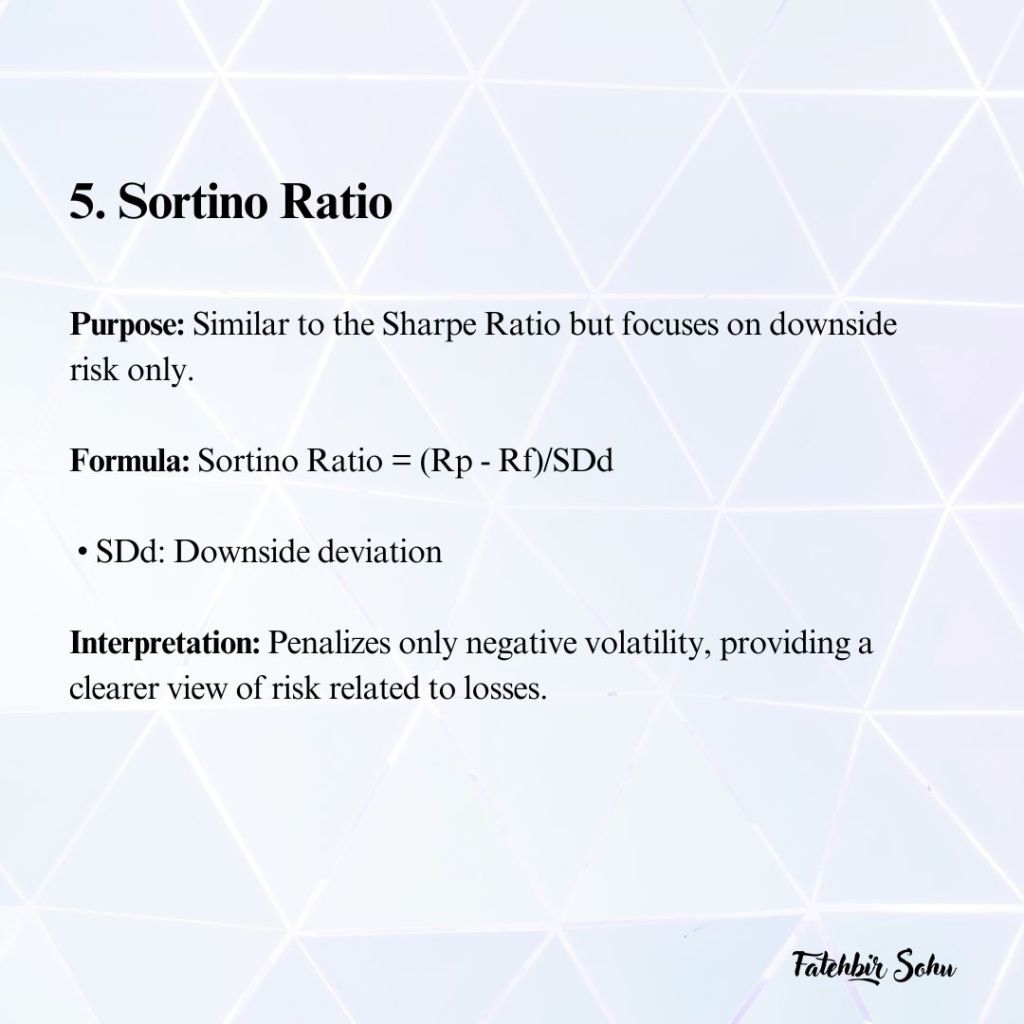
5. Sortino Ratio: Similar to the Sharpe Ratio but penalizes only downside risk.
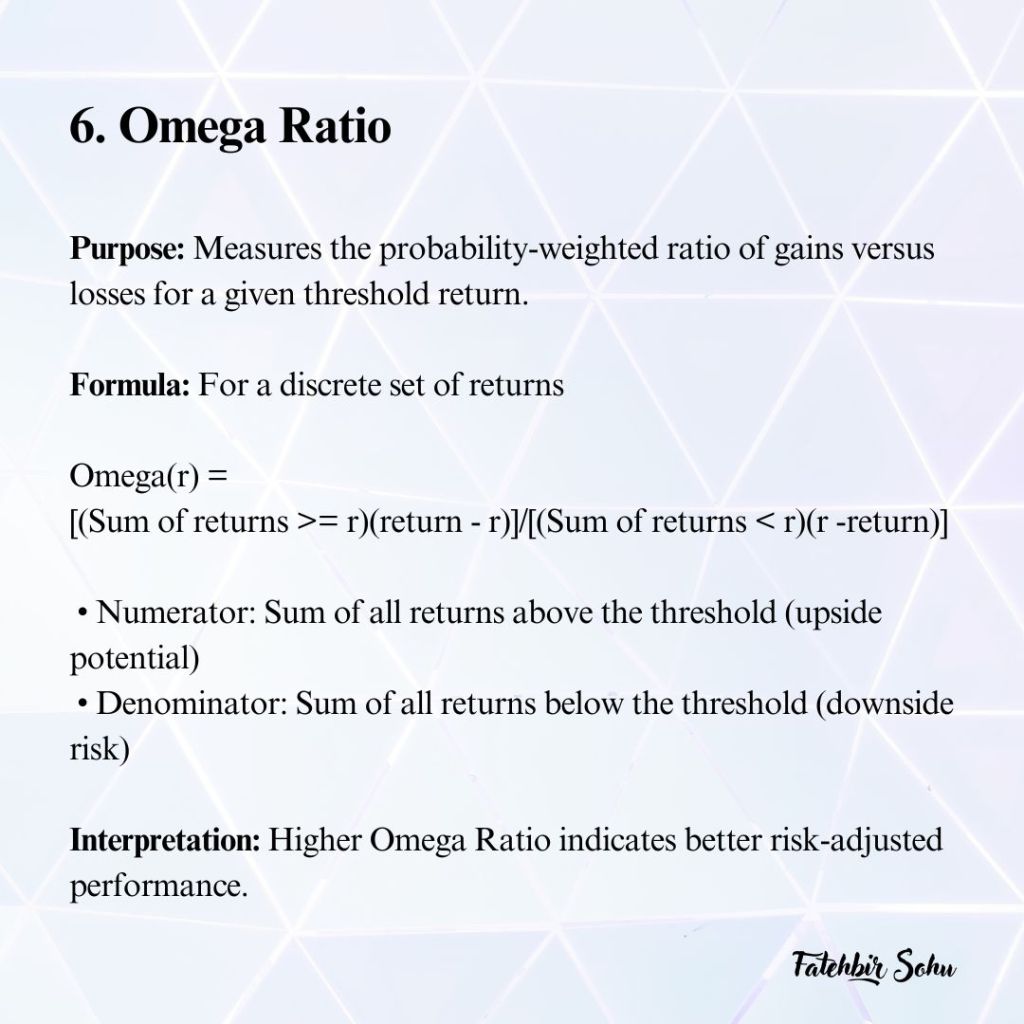
6. Omega Ratio: Evaluates the probability-weighted ratio of gains versus losses.
7. Calmar Ratio: Measures return relative to maximum drawdown.
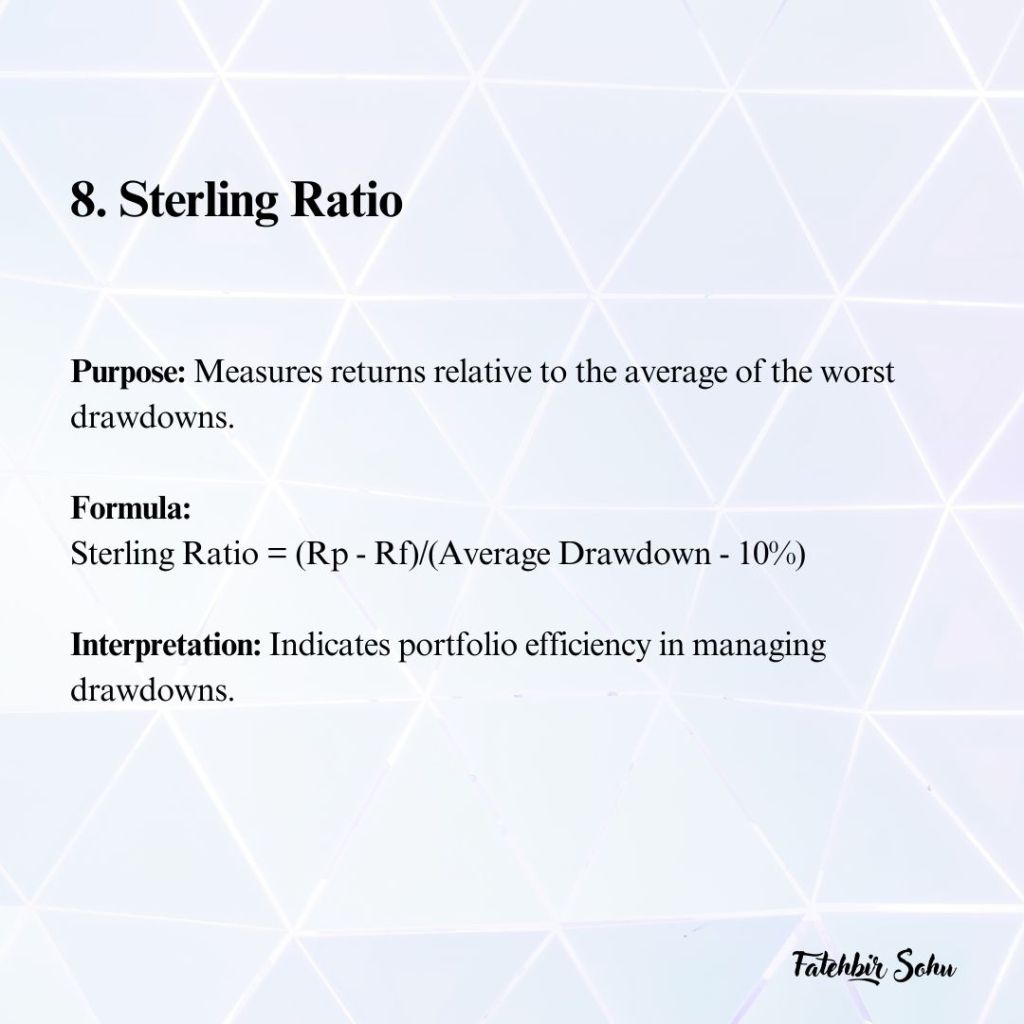
8. Sterling Ratio: Similar to Calmar but averages multiple drawdowns.
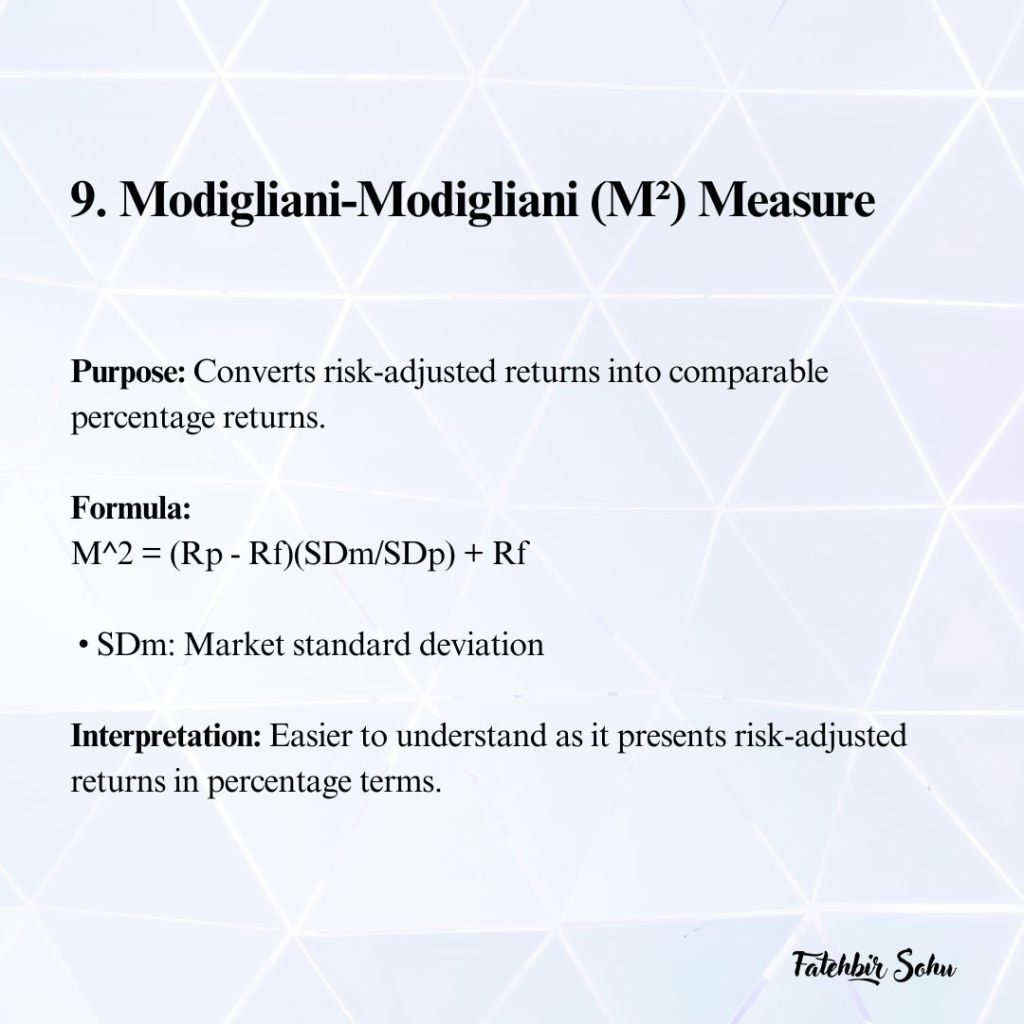
9. Modigliani-Modigliani (M²) Measure: Converts risk-adjusted returns into easy-to-understand percentages.
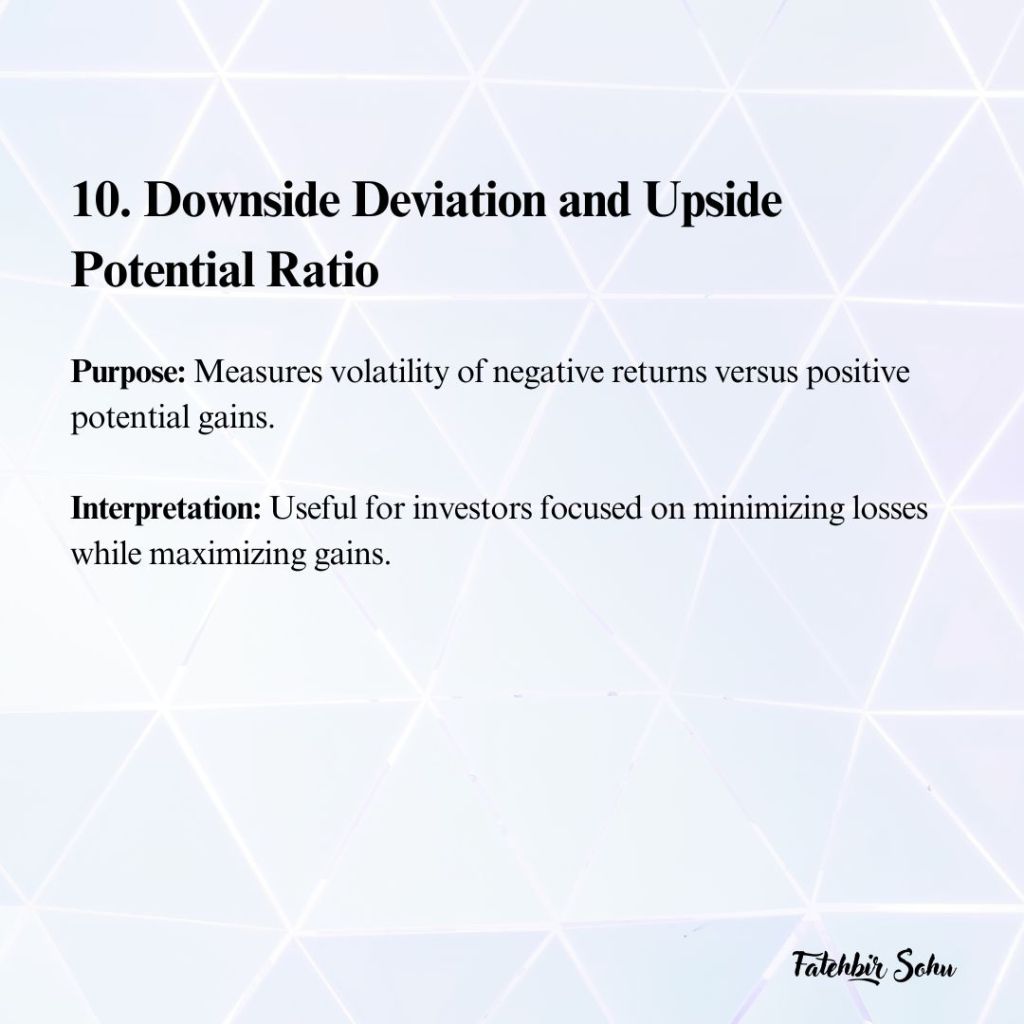
10. Downside Deviation & Upside Potential Ratio: Focus on negative volatility and the potential for gains relative to downside risk.
💡 Why does this matter?
Risk-adjusted metrics ensure you’re not just chasing high returns but evaluating whether those returns are worth the risk taken. After all, higher returns are meaningless if they come with disproportionate risk.
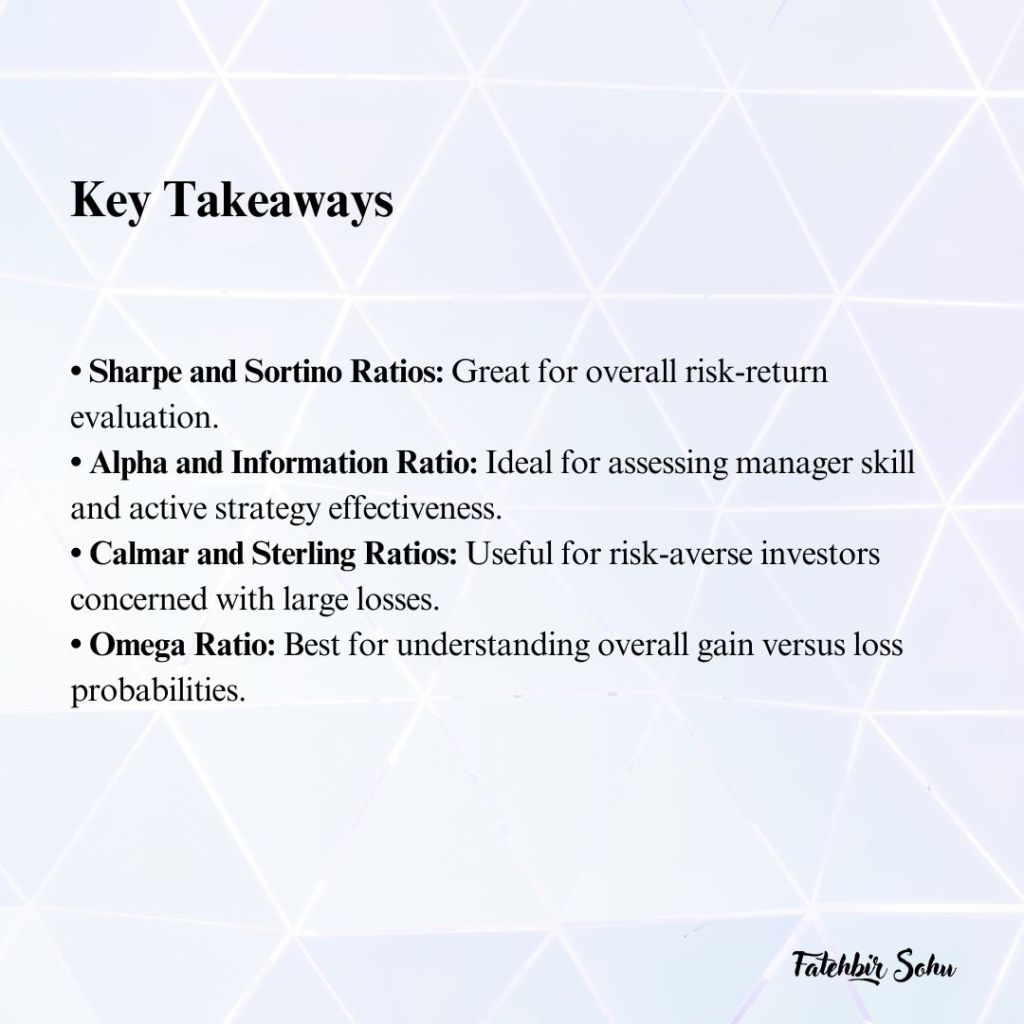
💬 Key Takeaways
1. Sharpe and Sortino Ratios: Great for overall risk-return evaluation.
2. Alpha and Information Ratio: Ideal for assessing manager skill and active strategy effectiveness.
3. Calmar and Sterling Ratios: Useful for risk-averse investors concerned with large losses.
4. Omega Ratio: Best for understanding overall gain versus loss probabilities.